

The True Cost Of Discrimination

Women, and men from ethnic minority groups, would have extra incomes totaling an extra £127 billion a year, or £9,300 each if they matched those of White British men according to a new analysis from the London School of Economics.

The Total Breaks Down As Follows:

-

£500 Million
In total for Indian men
-

£1.9 Billion
In total for Pakistani men
-

£800 Million
In total for Bangladeshi men
-

£400 Million
In total for Black Caribbean men
-
£1.2 Billion
In total for Pakistani women
-

£1 Billion
In total for Black African men
-

Less Than £50 Million
In total for Chinese men
-

£100 Million
In total for other Non-White men
-

£1.3 Billion
In total for Indian women
-
£600 Million
In total for Bangladeshi women
-
£900 Million
In total for Black Caribbean women
-

1.6 Billion
In total for Black African women
-

£400 Million
In total for Chinese women
-

£11.7 Billion
In total for Non-White women
-

£103.1 Billion
In total for White women in the UK

Income gaps (£ per week) (vs White UK men at £676.8/week)
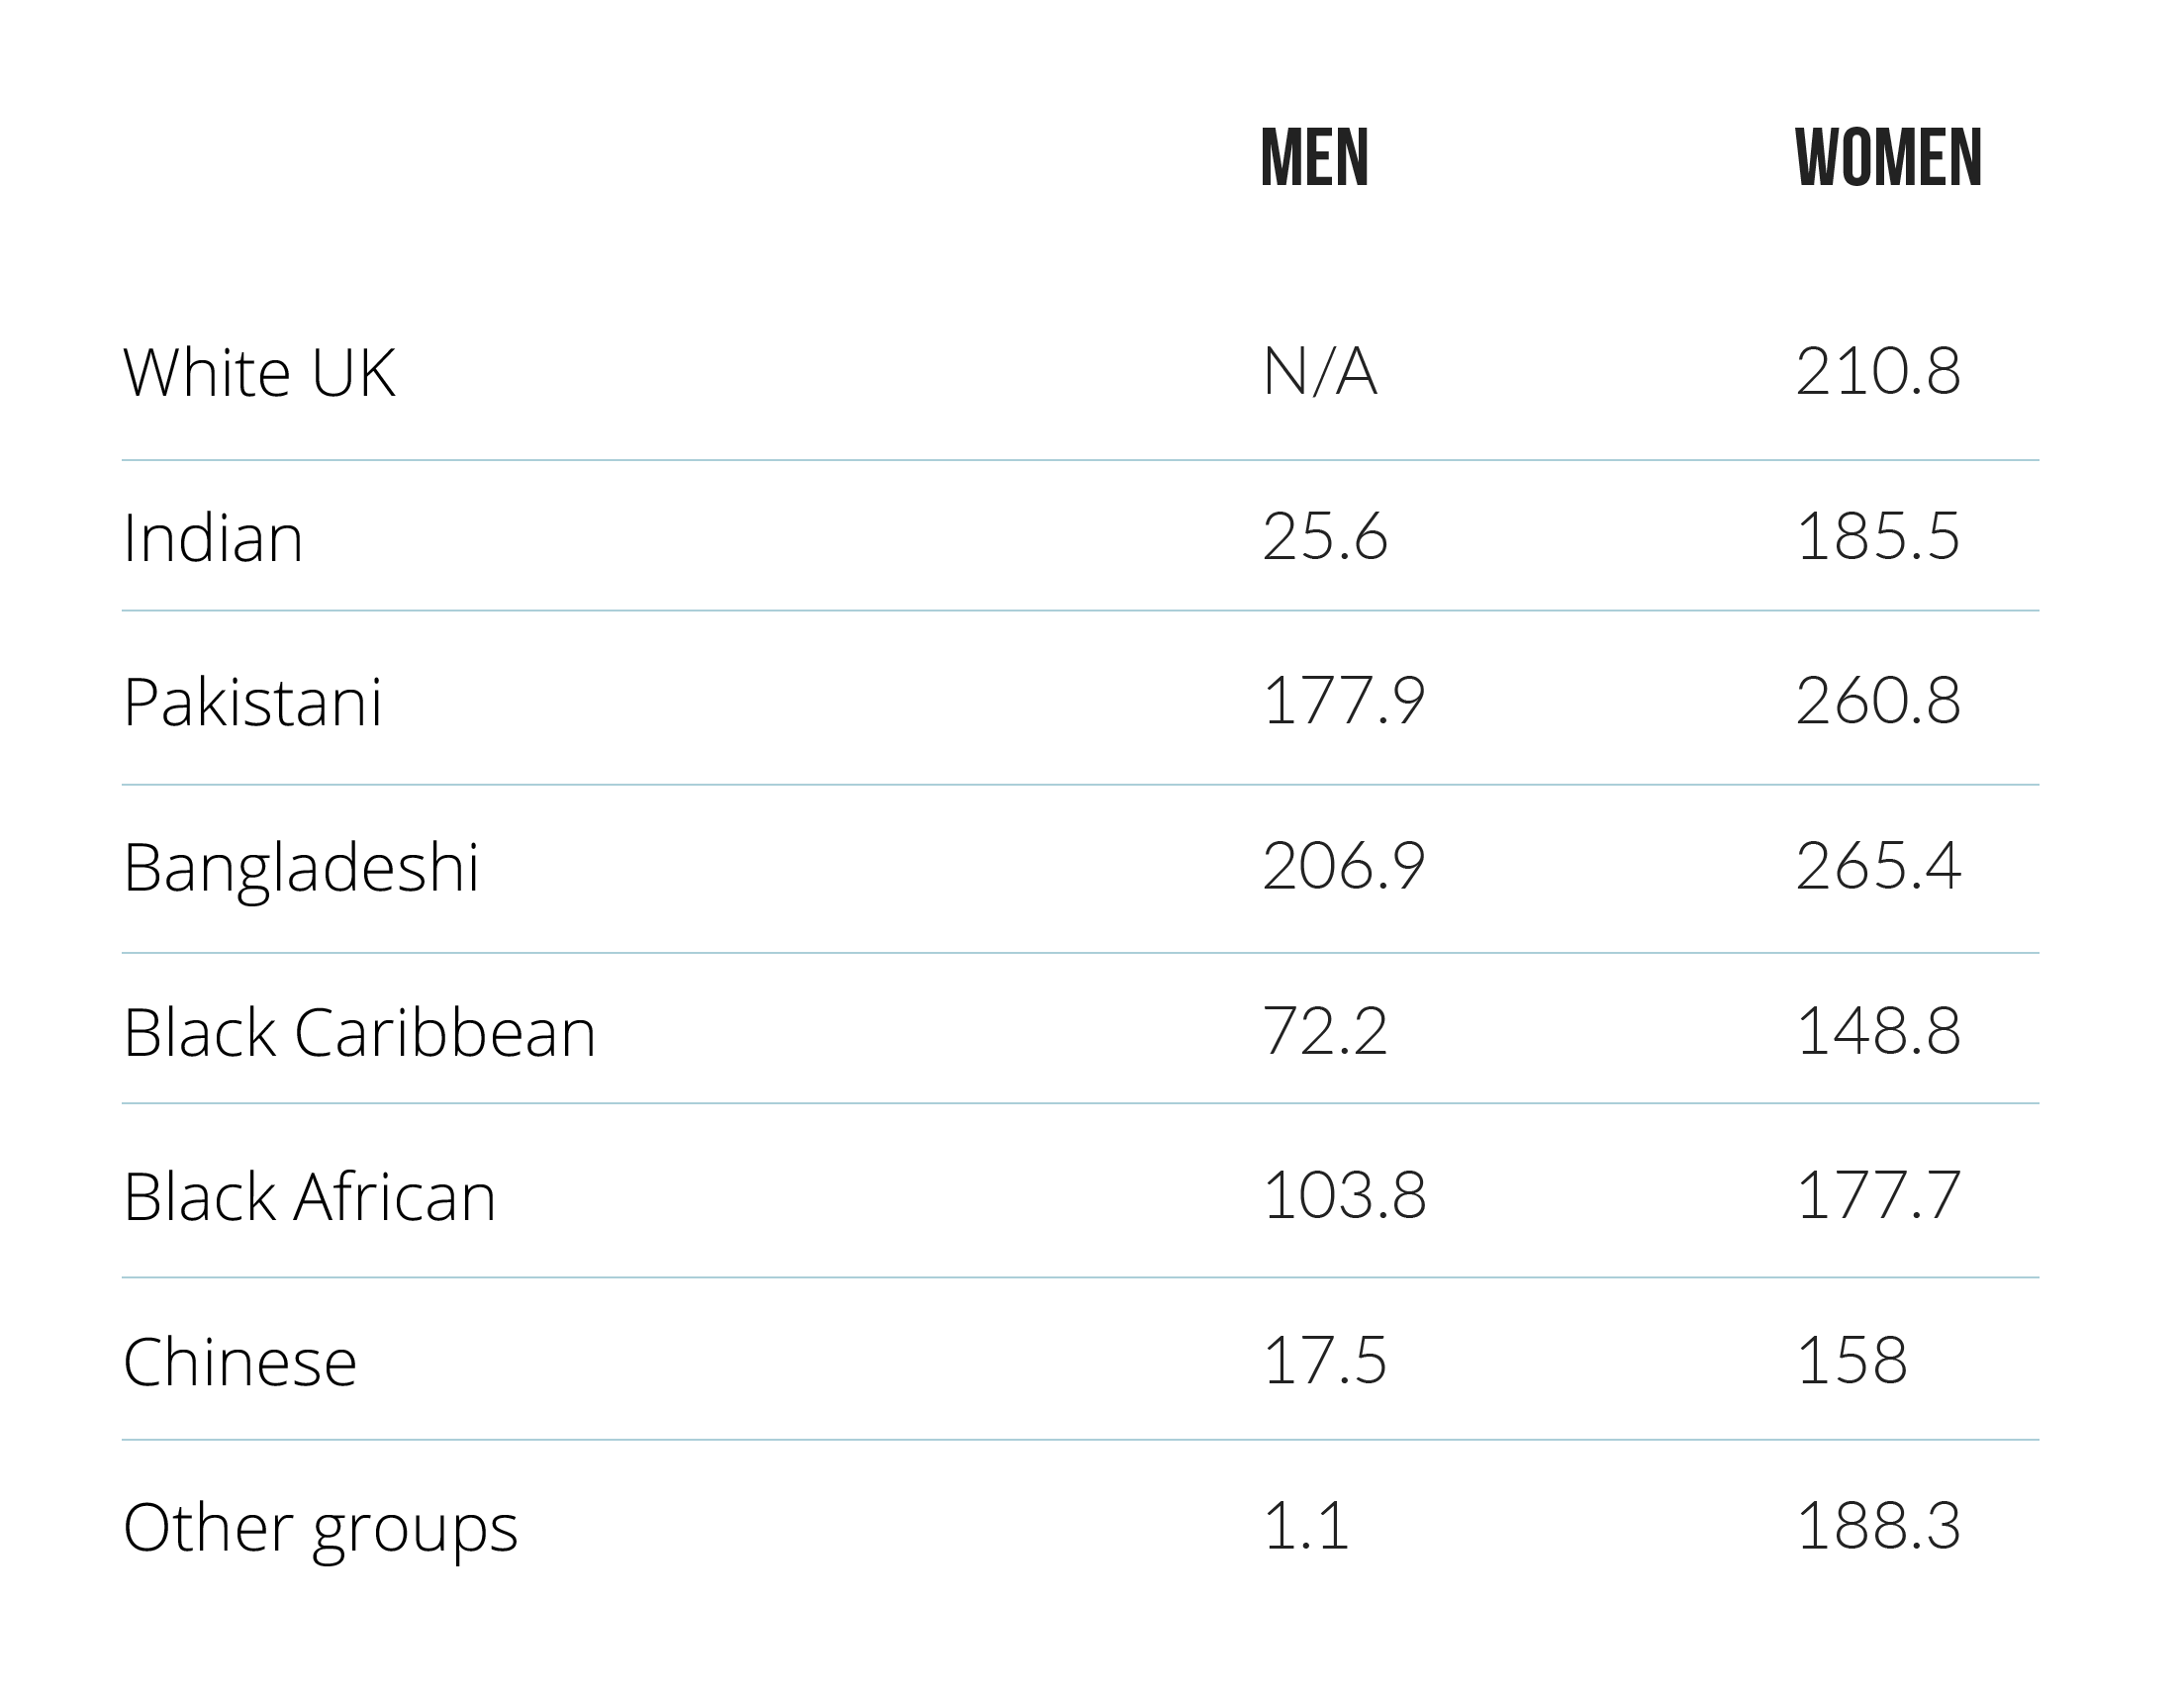
Income Gaps (£ per year) vs White UK men at £35,193.6p/year
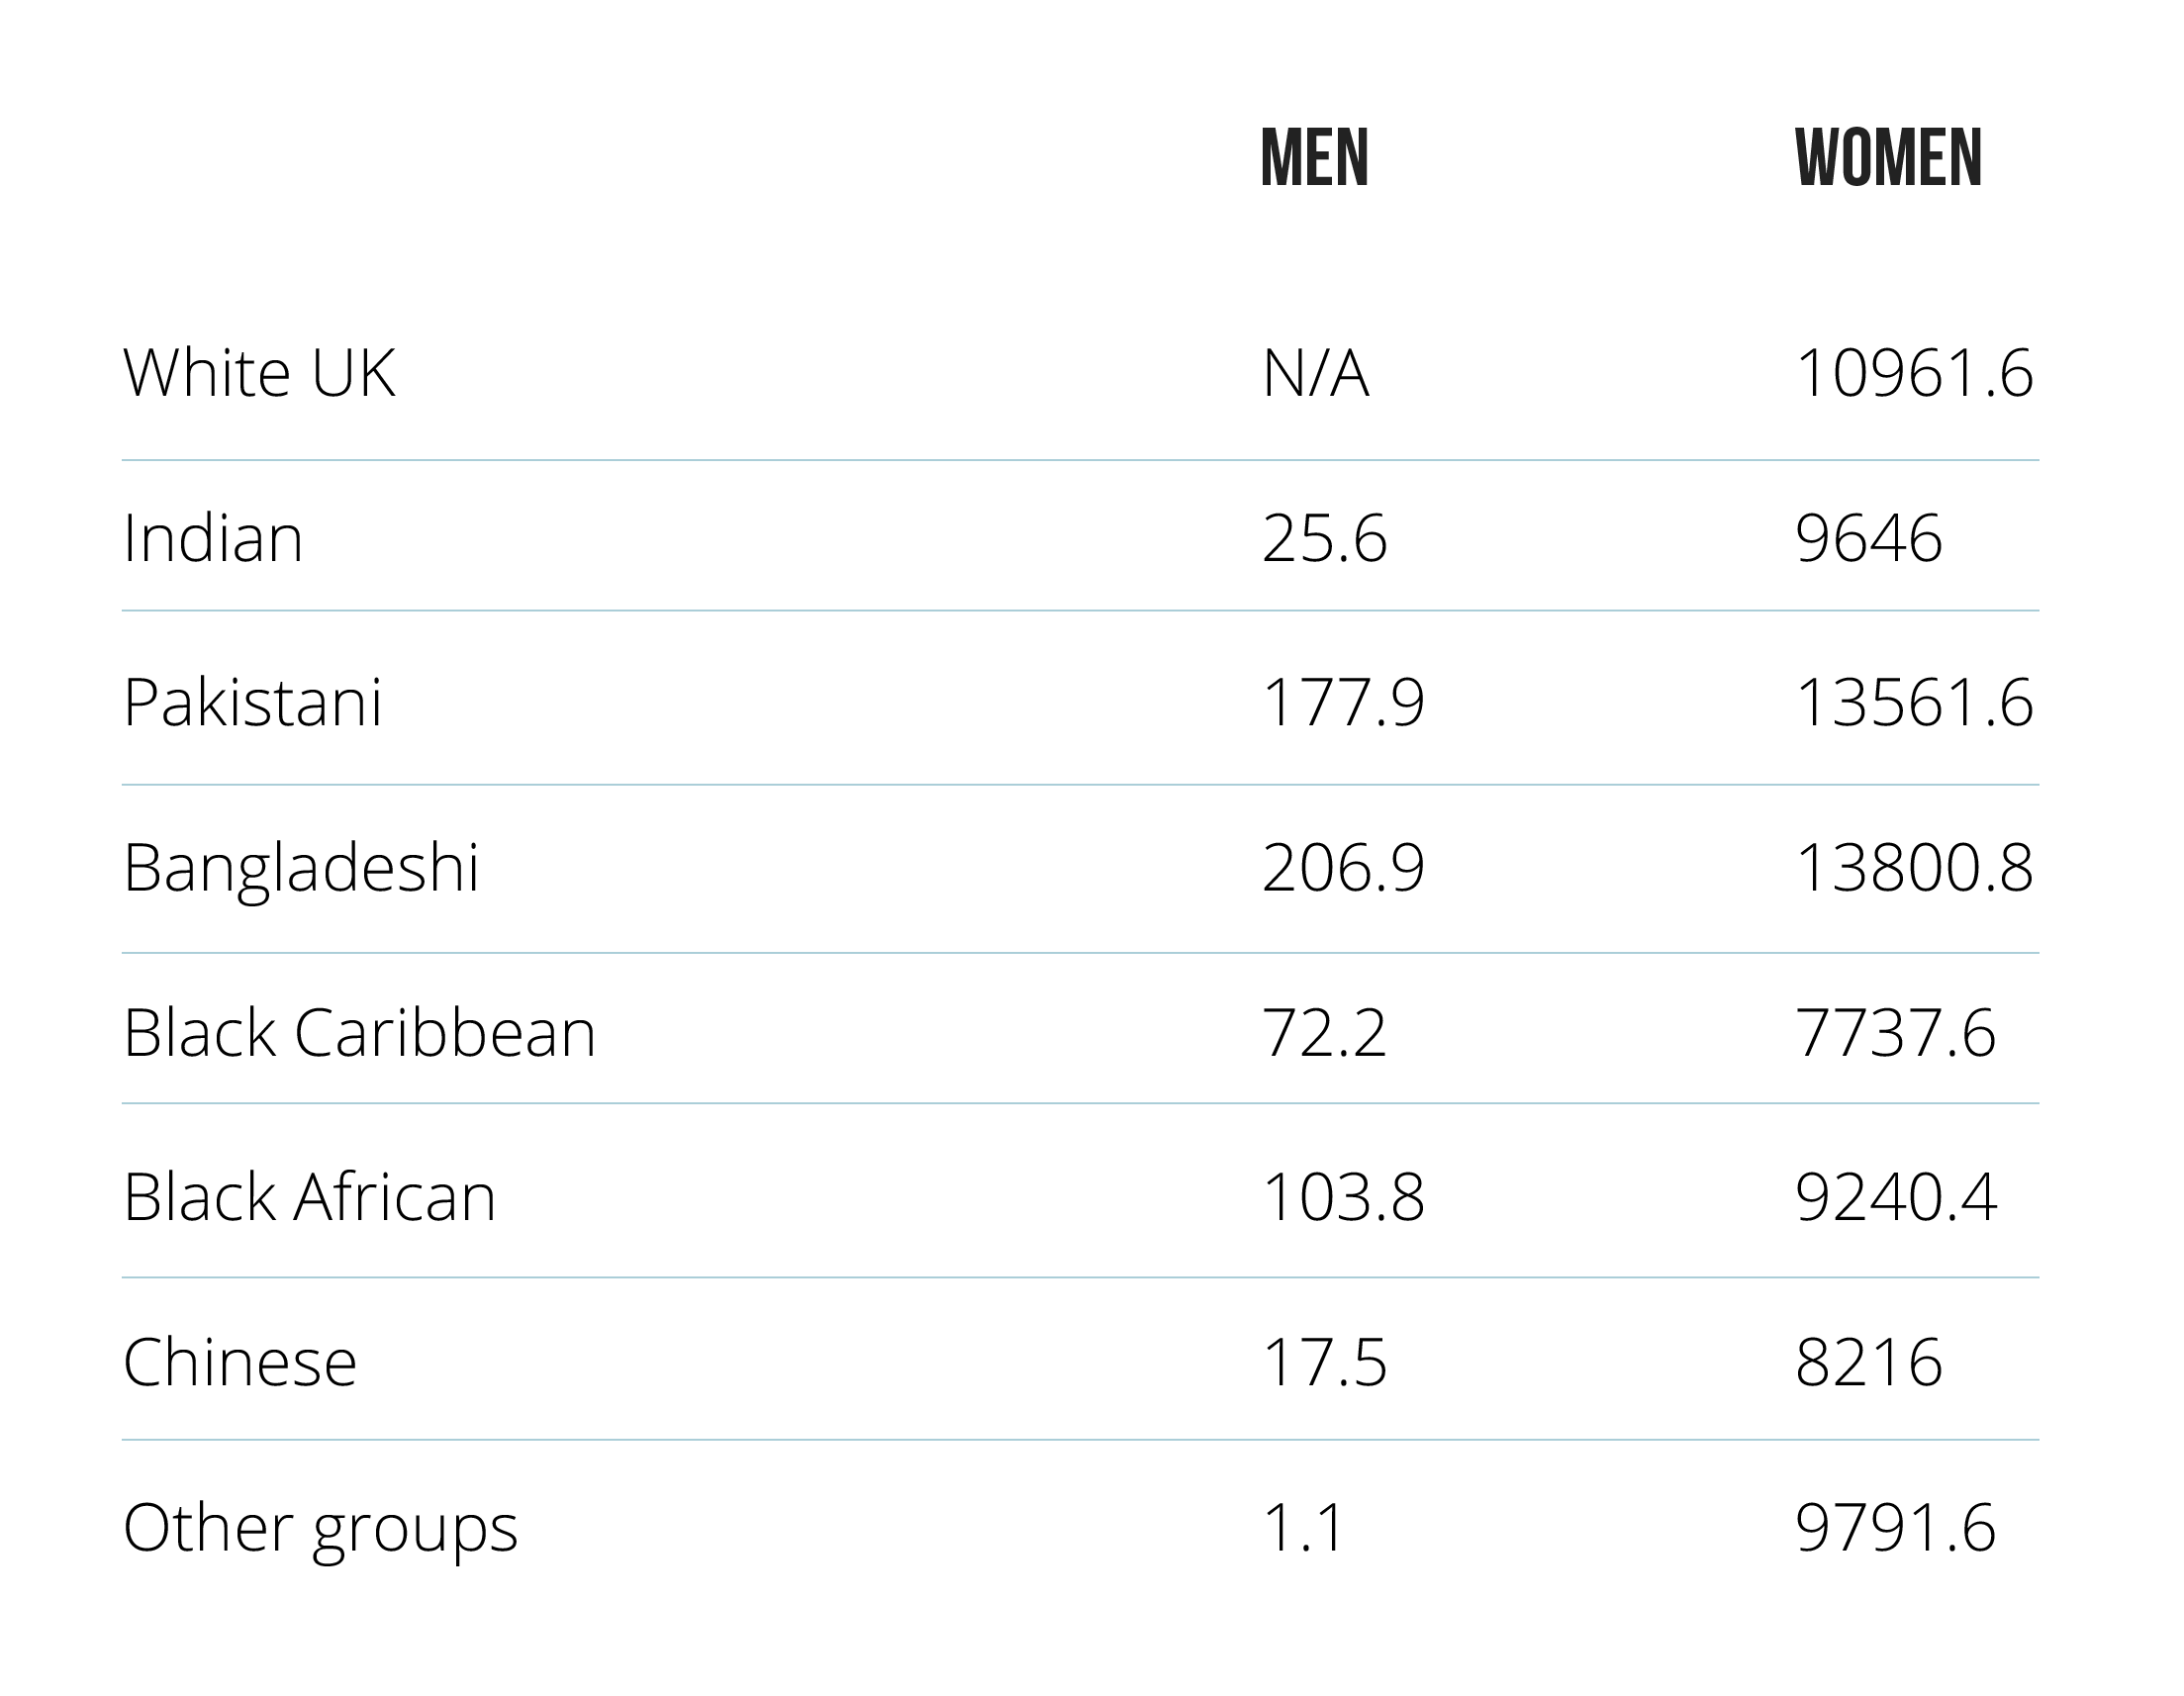
The figures are for income gaps compared to White British men. Differences reflect qualifications and occupation etc. but also actual rates of employment, as well as differences in other sources of income (which only make up a small share of incomes of this group). Gaps would be bigger for many if those who were out of the labour market for caring responsibilities or disability were included, but are not counted as economically active. Some of the differences will reflect differences in qualifications, but working age White British men do not now have lower levels of qualifications than most of the other groups [can give reference, if needed]. Previous research suggests that pay differences persist even when educational qualifications and occupation are controlled, with ‘pay penalties’ allowing for these of a similar scale to the pay gaps seen before allowing for them. For younger adults, with higher levels of qualifications, the penalties are even larger.
The figures are based on analysis by the International Inequalities Institute and Department of Social Policy at the London School of Economics, comparing the incomes that economically active adults in Great Britain (aged 16-59) received in their own right beIn total fore tax during the years 2009/10 to 2014/15 (using data from the Family Resources Survey) by gender and ethnicity , and converted to 2014 prices. The analysis uses results which update work originally published Nandi, A. and Platt, L. (2010) Ethnic Minority Women’s Poverty and Economic Well-Being. London: Government Equalities Office. See also E. Karagiannaki and L Platt (2015), The changing distribution of individual incomes beIn total fore and after the recession http://sticerd.lse.ac.uk/dps/case/cp/casepaper192.pdf